Sprint Reporting
Reports is one hub with 9 real, independently-permissioned report types — from a one-page Executive Summary built for leadership, to a fully open-ended Jira Custom Report that pivots any field on any issue. Every report reads the exact same live data the rest of SprintUnity already computes (Sprint Intelligence, Team Intelligence, Risk Management, Evaluation, Vote sessions) — nothing here is a separate, drifting copy of the numbers you see elsewhere in the app.
Where Reports lives
Reports is a single hub page (ReportsHub) with no in-page tab row of its own — all 9 reports are selected directly from the sidebar's own Reports group, and each one mounts only while it's the active sidebar item. Seeing the Reports group at all requires Reports.View; seeing any individual report inside it requires that report's own permission on top — someone can hold Reports.View and still see only 3 of the 9 sub-pages if that's all they're granted.
The 9 reports, in depth
1. Executive Summary Report
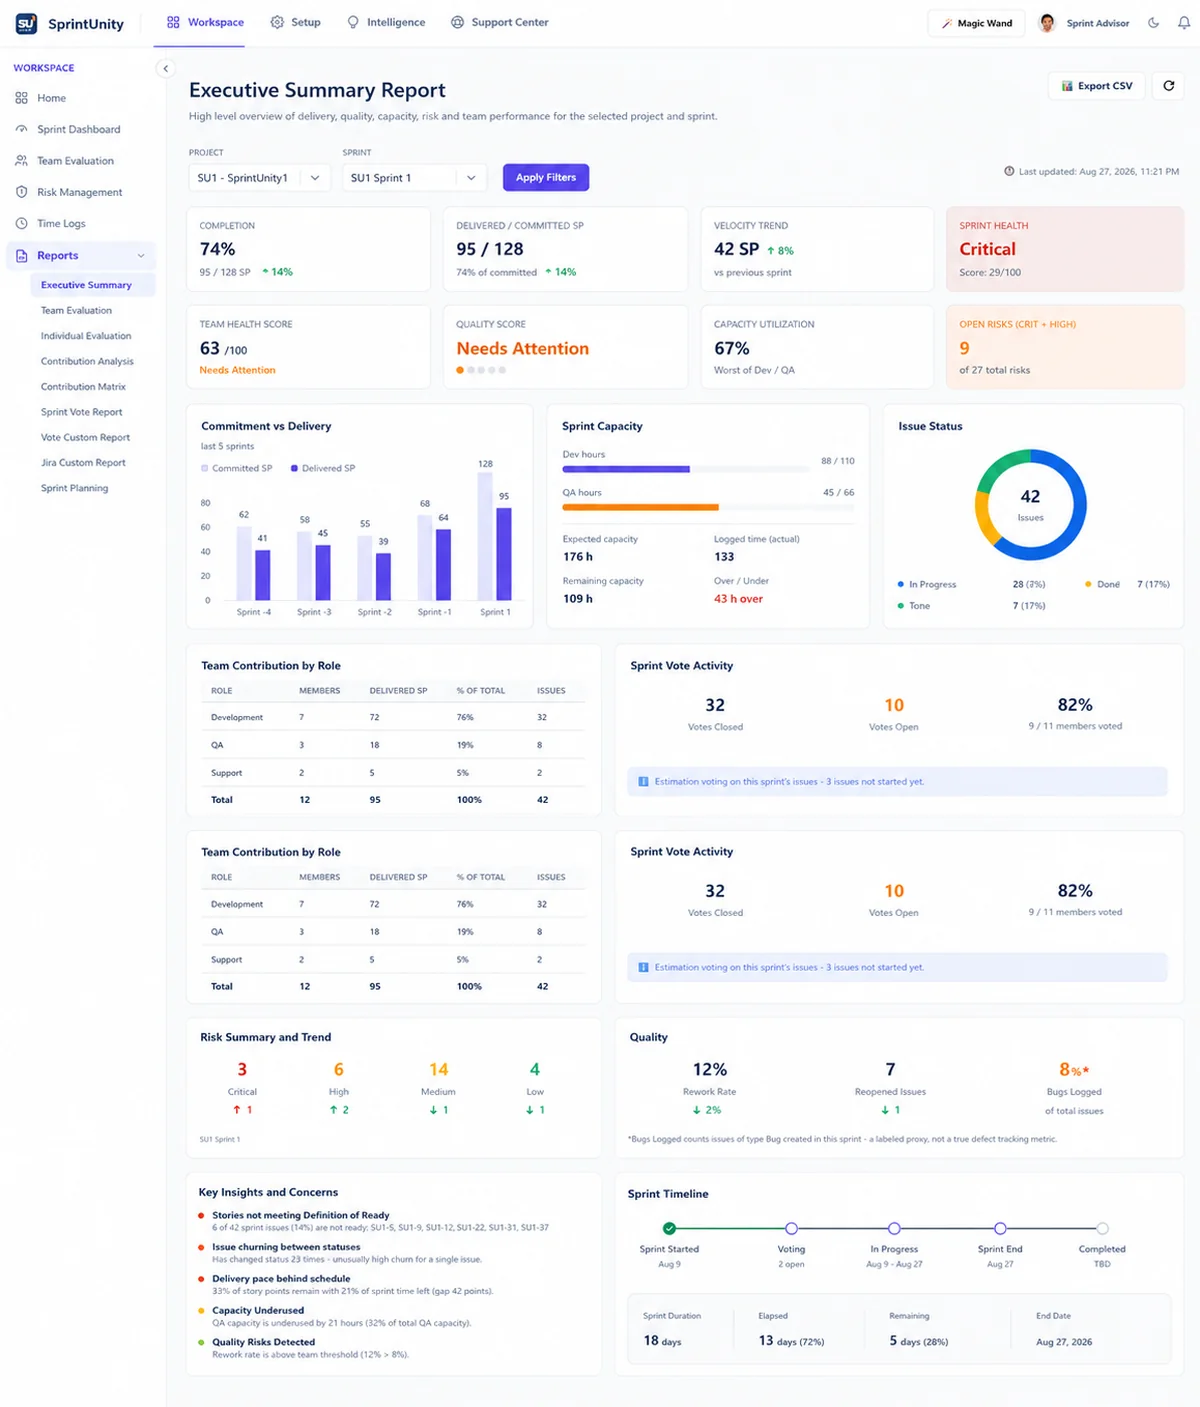
One project + one sprint, one page. The single richest report in the hub — a real rollup of Sprint Intelligence, Team Intelligence, Risk Management, Sprint Capacity, and Sprint Vote data, auto-triggering analysis in the background the first time a sprint is opened (instead of sending you to three other pages to click "Analyze" first).
What's on it — 10 panels
KPI row (Completion %, Delivered/Committed SP, Velocity Trend, Sprint Health, Team Health Score, Quality Score, Capacity Utilization, Open Risk); Commitment vs Delivery (bar trend, last N sprints); Sprint Capacity (Dev/QA hour bars + expected/logged/remaining/over-under); Issue Status (donut); Team Contribution by Role (table); Sprint Vote Activity (closed/open/participation %); Risk Summary and Trend; Quality (rework rate, reopened issues, "Bugs Logged" proxy); Key Insights and Concerns (merged from Sprint + Team Intelligence findings, capped at 5); and a Sprint Timeline strip.
How the numbers are calculated
Completion % = delivered SP ÷ committed SP. Velocity Trend = % change in delivered SP vs. the immediately preceding sprint. Capacity Utilization reuses Sprint Intelligence's own capacity_pct (worst of Dev/QA). Rework Rate = reopened issues ÷ total issues. "Bugs Logged" is explicitly labeled a proxy — it counts issues of type Bug created in the sprint, not a true QA-defect metric, since no defect-tracking concept exists in the data model. The Voting timeline step's state is derived from the same open/closed vote counts as Sprint Vote Activity, so the two can never contradict each other.
Export: CSV only (a Word export wasn't built for this shape — the app's existing Word builder is shaped for the Evaluation report's tables instead). Permission: Reports.Executive.
2. Team Evaluation Report
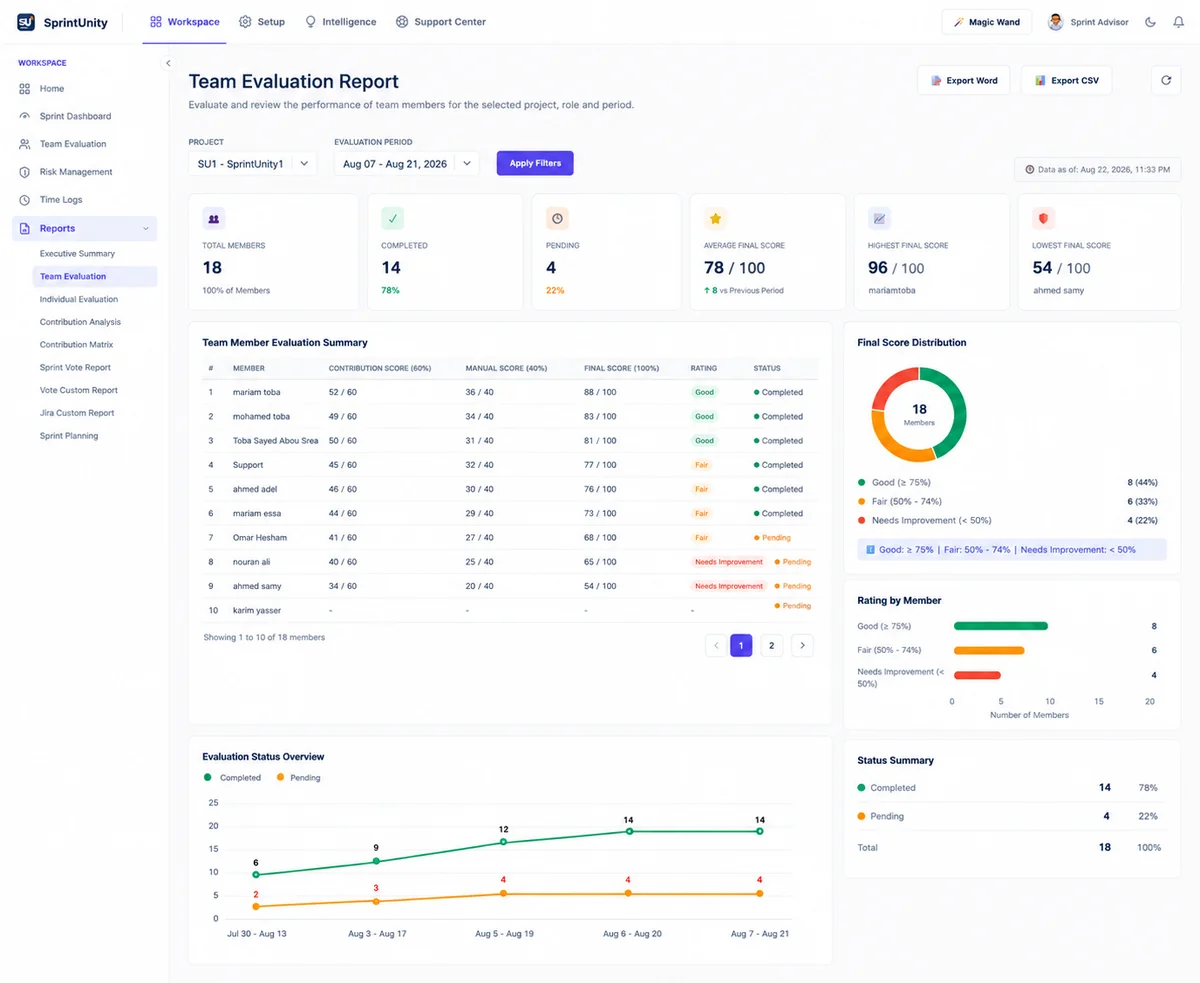
Every member evaluated under one role, for one period — a print/export-ready version of the Evaluation Summary tab covered on the Team Performance & Evaluation page. There's no separate "Team" entity in the data model, so this is really "everyone evaluated under this role," not a distinct team roster.
What's on it — 6 panels
KPI row (Total Members, Completed, Pending, Average Final Score with a vs.-previous-period delta, Highest Final Score, Lowest Final Score); Team Member Evaluation Summary table (Contribution / Manual / Final Score, rating, status, paginated 10 rows at a time); Final Score Distribution (donut, Good/Fair/Needs Improvement); Rating by Member (horizontal bar); Evaluation Status Overview (a 2-line trend of Completed vs. Pending across the last 5 periods); Status Summary.
An honest labeling gap worth knowing
The member table's column headers read "Contribution Score (60%)" / "Manual Score (40%)" — a fixed 60/40 split hardcoded into this report's display, even though the real underlying finalScore formula uses each role's own configured Contribution Ratio from the setup wizard (defaulting to 50/50, not 60/40). The Final Score value itself is always the real stored number; only these two column labels can be misleading if a role's ratio was changed away from the wizard's old default.
Export: CSV and a real Word (.docx) report, built directly from that period's results. Permission: Reports.TeamEvaluation.
3. Individual Evaluation Report
One member, one project, one role, one period — the deepest single-person view in Reports. Defaults to the current period's top scorer when first applied, then lets you switch periods or members.
What's on it — 8 panels
Evaluation Profile (name, rank out of the role's total members, final score with its band); Contribution by Issue Type (donut, from the member's own contribution_breakdown); Manual Evaluation Scores (every enabled criterion with its weight and live weighted contribution); Score Breakdown (a two-tone gauge splitting Contribution vs. Manual into the final score); Evaluation Summary card; Contribution Trend across the last 5 periods; Evaluation Notes (the evaluator's free-text notes, if any); Recent Contributions (a live-fetched, paginated list of the member's own Jira issues for that period, each tagged Assignee / Creator / Reporter / Contributor, sorted by the issue's own updated date).
Two things intentionally not carried over from an earlier mockup
A separate "Member Notes" self-reflection field was dropped — the schema only has one evaluator-written notes column, not two. A cross-project "Top Contributed Projects" section was also dropped — contribution is only ever fetched per-project, so there's no real cross-project rollup to show. The same hardcoded 60%/40% split noted on the Team Evaluation Report also appears here in the Score Breakdown gauge's two arcs.
Export: CSV. Permission: Reports.IndividualEvaluation.
4. Contribution Analysis Report
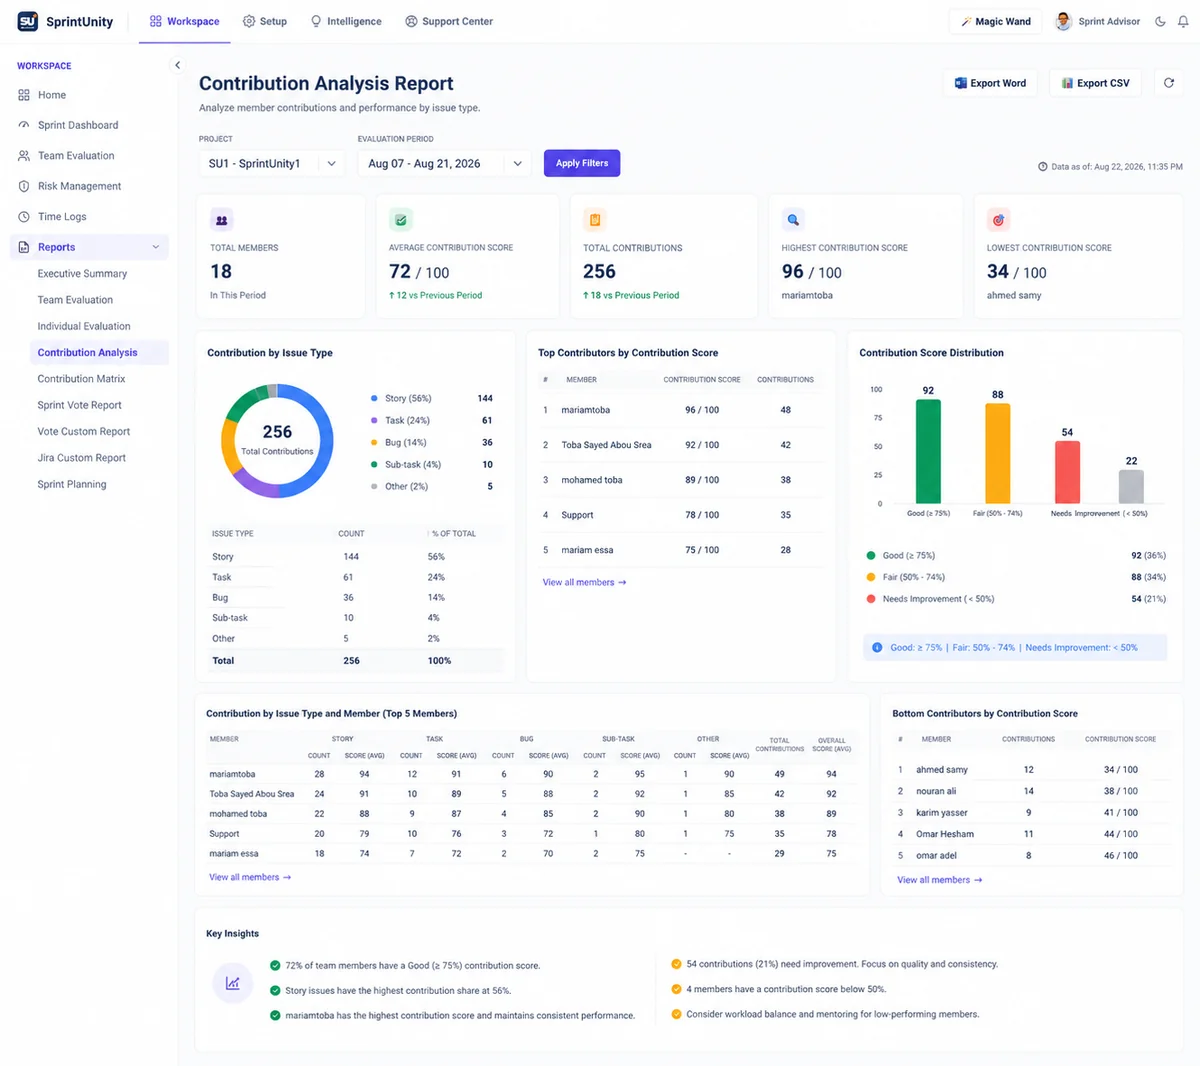
One project + role + period, focused entirely on the automatically-measured Contribution Score side of evaluation — not the manual criteria, not the final blended score.
What's on it — 7 panels
KPI row (Total Members, Average Contribution with a vs.-previous-period delta, Total Contributions with its own delta, Highest Contributor, Lowest Contributor); Contribution by Issue Type (donut, summed across every member's breakdown); Top Contributors by Contribution Score (ranked, expandable from 5 to 10 rows); Contribution Score Distribution (the same real 3-tier Good/Fair/Needs Improvement scale used everywhere else in the app — collapsed from an earlier 5-tier mockup scale that didn't correspond to anything actually stored); Contribution by Issue Type and Member (a matrix preview); Bottom Contributors; Key Insights (up to 4 rule-based observations — score delta direction, dominant issue types, top scorer, and a count of anyone below the 50% threshold).
Same rating scale everywhere
There is now exactly one performance rating scale in the whole product — Good ≥75%, Fair 50–74%, Needs Improvement <50% — applied here to Contribution Score specifically, and to Final Score on the two Evaluation reports. No page in the app uses a different scale.
Export: CSV. Permission: Reports.ContributionAnalysis.
5. Contribution Matrix Report
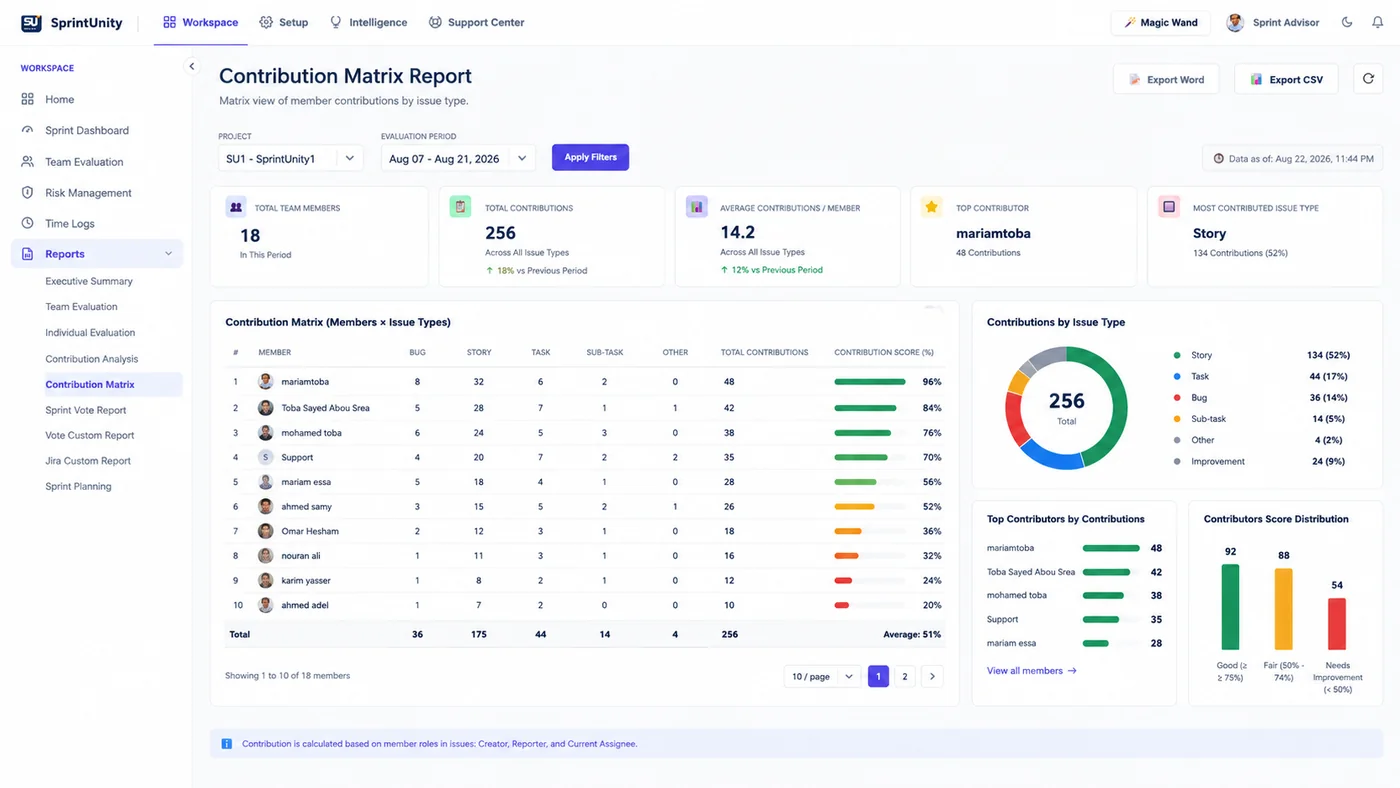
The same underlying data as Contribution Analysis — contribution_score and contribution_breakdown across every member of one project + role + period — but presented matrix-first: every member against every issue type, paginated from the start (10/25/50 rows per page) rather than a top-5 preview.
What's on it — 5 panels
KPI row; Contribution Matrix (Members × Issue Types, the primary table); Contributions by Issue Type (donut); Top Contributors by Contributions (ranked by raw contribution count, not score); Contribution Score Distribution (same 3-tier scale).
Export: CSV. Permission: Reports.ContributionMatrix.
6. Sprint Vote Report
One project + sprint, focused on story-point voting itself — the only report that fetches per-issue vote details in bulk (the same call the app's own "eye icon" Vote Details dialog uses), giving it real numbers no other report has: individual vote timestamps, per-vote story points and hours, and true voter counts.
What's on it — 9 panels
KPI row; Vote Status (donut, Completed vs. Open); Story Point Distribution (Final) — a bucketed bar chart of each closed issue's final story point value; Estimated Hours Distribution — issues bucketed into 6 hour ranges (0–4 up to 60+); Voting Summary (total voters, votes cast, average votes per issue, voting start/end and duration); Top Voted Issues by Story Points; Average Story Point Trend (Daily) — the daily average of every individual vote's submitted story points, bucketed by the vote's own timestamp; Sprint Issues Vote Overview (full table with a DOR status column); Vote Settings (Allow Reopen, a link to Story Point Mapping).
Honest substitutions from the original mockup
"Voting Started On" / "Voting Closed On" aren't a single stored sprint-level event — voting is tracked per issue, session by session — so these are derived as the earliest and latest individual vote timestamp across the whole sprint, not a fixed date. "Votes (Given/Total)" uses the sprint's real total unique voters as "Total," since there's no separate "eligible voters per issue" concept. "Min Votes Required," "Voting Closed By," and "Closed On" were dropped entirely — no setting or stored field for any of them exists anywhere in the app. "Voting Method" is shown as a fixed factual label (every vote always captures both story points and hours), not a real configurable setting.
Export: CSV. Permission: Reports.SprintVote.
7. Vote Custom Report
A pivot-table builder over Sprintunity's own voting data, scoped to one project across any number of its sprints — pick a date range or hand-pick sprints, group and order by Sprint and/or Issue Type (the only two dimensions this data actually supports once scoped to one project), choose which measures to show, and generate.
Available measures
Total Issues, Votes Completed, Open Votes, Total Voters, Final Story Points, Total Estimated Hours, Average Story Point, DOR Ready, DOR Not Ready — plus filters for Vote Status and DOR Status.
What was deliberately left out
No Fix Version / Release filter (nothing in the app fetches Jira fix versions today). No Save Report / Save As (no report config is persisted anywhere — every run is generated fresh). No Team / Group filter (no Team entity exists in the data model). Project is a single-select scope, not a groupable dimension — with only one project in play, grouping by it would always produce one no-op top-level group.
Export: CSV, Excel, PDF, and Word — all four, hand-rolled in-browser. Permission: Reports.VoteCustomReport. Because the output shape is entirely user-defined, this report gets no numeric Advisor summary skill — only "Explain this report."
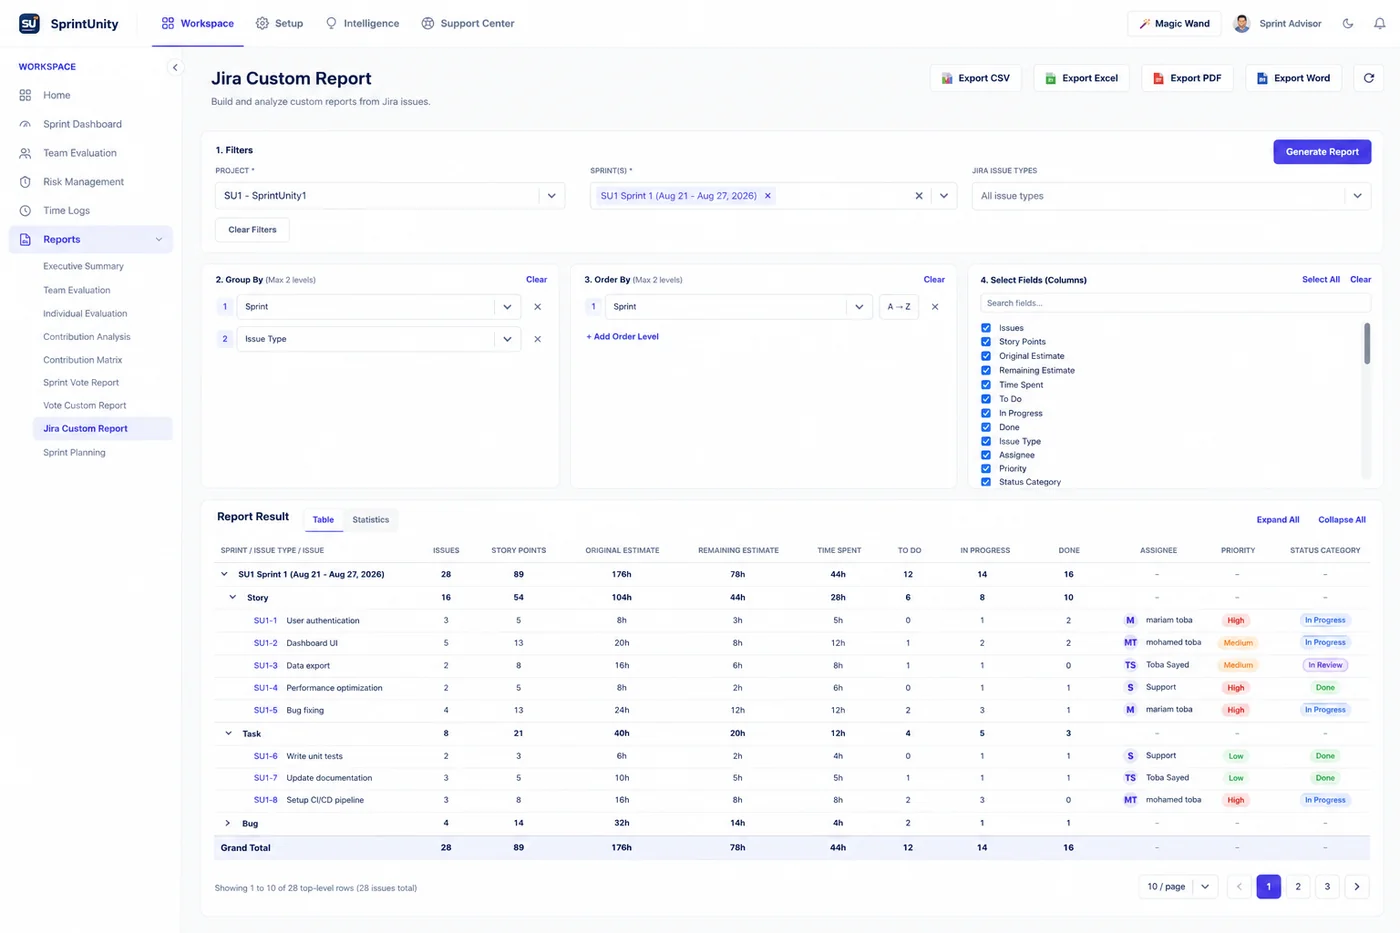
8. Jira Custom Report
The most open-ended report in the hub — a raw-Jira-issue pivot builder, distinct from Vote Custom Report because it searches live Jira issues directly (project + sprints + optional issue-type filter) instead of reading Sprintunity's own vote tables.
Group by / Order by any field
Up to 2 grouping levels, drawn from every standard and custom field on the site — the same field catalog the DOR rule editor already uses. Individual issues are always the innermost level beneath whatever grouping is chosen (or the full flat list, with no grouping selected). "Select Fields" doubles as both the leaf rows' columns and each group row's aggregate: sums for numeric fields, distinct counts for text/people fields, "-" for anything that doesn't meaningfully aggregate.
Curated fields get real typed rendering
Assignee, Reporter, Creator, Status (3 real Jira status categories — To Do / In Progress / Done, not a 4th guessed bucket), Priority, Labels, Components, dates, Original/Remaining Estimate, Time Spent, Fix Version, Parent, and a best-effort Epic (resolved via the classic "Epic Link" field where it exists, falling back to the issue's parent when that parent is itself an Epic). Any other field — standard or custom — is discovered dynamically and rendered best-effort from its raw Jira value and schema type.
Export: CSV, Excel (with genuine native row-outline grouping matching the on-screen tree), Word, and PDF (landscape, paginated; PDF text is Latin-1-ish only — anything else renders as "?" rather than corrupting the file). No Save Report / Load Report — nothing persists. No row-level "open in Jira" action, since nothing in the app currently deep-links to raw Jira issue pages. Permission: Reports.JiraCustomReport. Like Vote Custom Report, this gets no numeric Advisor summary skill — the shape is entirely up to you.
9. Sprint Planning Report
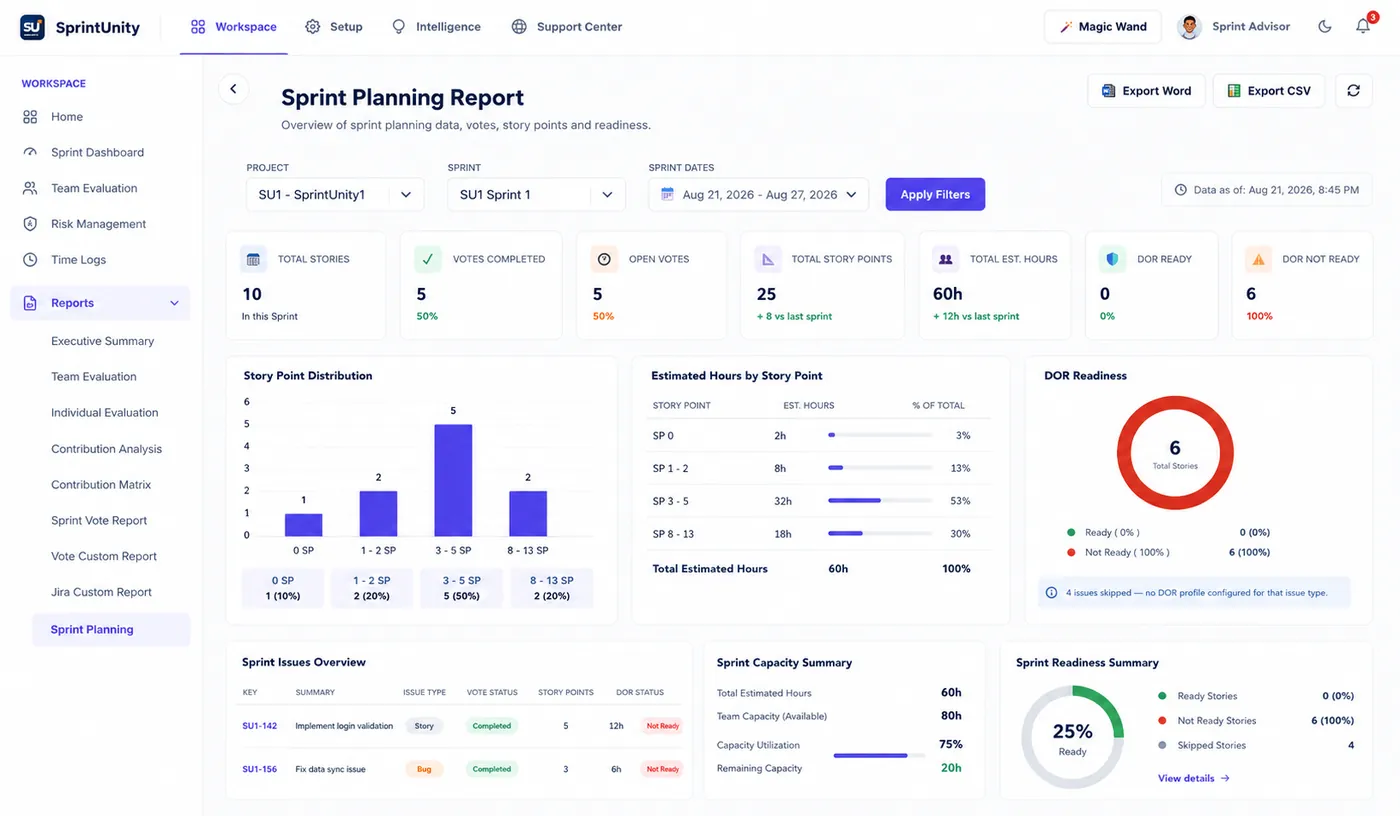
One project + sprint, focused on planning readiness — how much of the sprint is voted, estimated, DOR-ready, and how that workload compares to configured capacity.
What's on it — 8 panels
KPI row; Story Point Distribution (bucketed bar); Estimated Hours by Story Point (hours summed per SP bucket); DOR Readiness (Ready / Not Ready / No Profile, computed for real per issue type's enabled assessment profile — reusing the same evaluation endpoint the DOR settings preview tool already calls, just run across every issue in the sprint instead of one at a time); Sprint Issues Overview table; Sprint Capacity Summary (Available vs. Used vs. Remaining, with a real utilization %); Votes Status; Insights (rule-based notes on vote completion, capacity headroom, and the most common story point size).
A genuinely more accurate number than its own source page
This report's "Total Estimated Hours" is summed directly from the sprint's real issues, not read from Sprint Capacity's own usedDevHours field — which, at the time this report was built, was still a hardcoded demo value on that page. For capacity usage specifically, Sprint Planning Report is more accurate than the Sprint Capacity page it draws its limit from. The limit itself (maxDevHours) is real, pulled from the saved capacity record. No "Evaluation Role" filter exists here — votes, capacity, and DOR readiness aren't role-scoped anywhere in the data model.
Export: CSV. Permission: Reports.SprintPlanning.
Permissions — one hub gate, nine report gates
| Permission | What it controls |
|---|---|
Reports.View | See the Reports group in the sidebar at all |
Reports.Executive | View/export the Executive Summary Report |
Reports.TeamEvaluation | View/export the Team Evaluation Report |
Reports.IndividualEvaluation | View/export the Individual Evaluation Report |
Reports.ContributionAnalysis | View/export the Contribution Analysis Report |
Reports.ContributionMatrix | View/export the Contribution Matrix Report |
Reports.SprintVote | View/export the Sprint Vote Report |
Reports.VoteCustomReport | View/export the Vote Custom Report |
Reports.JiraCustomReport | View/export the Jira Custom Report |
Reports.SprintPlanning | View/export the Sprint Planning Report |
10 permissions in total. Each report checks its own permission independently — Reports.View only controls whether the Reports group shows up in the sidebar, not which reports inside it are visible. Someone can be granted 2 of the 9 report permissions and see exactly those 2 sub-pages, nothing more.
Magic Wand — a deterministic explainer on nearly every panel
Same rule-based, no-LLM approach as the rest of the app. Click the Magic Wand, then click any panel for a structured explanation of just that panel's own numbers — 58 explainable panels across the hub in total:
| Report | Magic Wand panels |
|---|---|
| Executive Summary | 10 (KPI Summary, Commitment vs Delivery, Sprint Capacity, Issue Status, Team Contribution, Vote Activity, Risk Summary, Quality, Key Insights, Sprint Timeline) |
| Team Evaluation | 6 (KPI Summary, Member Table, Score Distribution, Rating by Member, Status Overview Trend, Status Summary) |
| Individual Evaluation | 8 (Profile Summary, Contribution by Issue Type, Manual Scores, Score Breakdown, Evaluation Summary, Contribution Trend, Evaluation Notes, Recent Contributions) |
| Contribution Analysis | 7 (KPI Summary, Contribution by Issue Type, Top Contributors, Score Distribution, Contribution Matrix, Bottom Contributors, Key Insights) |
| Contribution Matrix | 5 (KPI Summary, Matrix Table, Issue Type Donut, Top Contributors, Score Distribution) |
| Sprint Vote | 9 (KPI Summary, Vote Status Donut, SP Distribution, Hour Distribution, Voting Summary, Top Voted Issues, Daily Trend, Issues Table, Vote Settings) |
| Vote Custom Report | 2 (Report Builder, Report Result) |
| Jira Custom Report | 3 (Filters & Builder, Result Table, Result Statistics) |
| Sprint Planning | 8 (KPI Summary, SP Distribution, Hours by Story Point, DOR Readiness, Issues Table, Capacity Summary, Votes Status, Insights) |
Every panel's explainer only ever receives that one panel's own narrow data slice — never the full report snapshot — the same context-boundary rule Magic Wand follows everywhere else in the app.
Ask Sprint Advisor about this
Reports shares one app-level page (pageId: "reports") no matter which of the 9 sub-reports is open, so Sprint Advisor tells them apart using the same reportType string each report publishes as it mounts. Beyond the universal "Explain this report" (available on all 9, no permission required), 7 of the 9 have a real numeric summary skill too:
| Report | Chat skill |
|---|---|
| Executive Summary | "Summarize this executive summary" + "What's the top concern for this sprint?" — 2 skills, both gated by Reports.Executive |
| Team Evaluation | "Summarize this evaluation report", gated by Reports.TeamEvaluation |
| Individual Evaluation | "Summarize this member's evaluation", gated by Reports.IndividualEvaluation |
| Contribution Analysis | "Summarize contribution analysis", gated by Reports.ContributionAnalysis |
| Contribution Matrix | "Summarize the contribution matrix" — the same underlying skill function as Contribution Analysis, since both read the identical eval_results rows, gated by Reports.ContributionMatrix |
| Sprint Vote | "Summarize sprint vote results", gated by Reports.SprintVote |
| Sprint Planning | "Summarize sprint planning readiness", gated by Reports.SprintPlanning |
| Vote Custom Report / Jira Custom Report | No numeric skill — their tables are fully user-configured pivots with no fixed schema, so only "Explain this report" is offered |
See AI Sprint Assistant for how Sprint Advisor and Magic Wand work together across the rest of the app.
How anyone with access gets value out of this
Start from the audience, not the data
Sharing with leadership? Executive Summary is the one page built for a one-glance read. Handling a performance conversation? Individual Evaluation, not the raw scoring screen. Need a board-level number nobody can argue with? Export it straight to CSV, Excel, PDF, or Word — whichever format the recipient actually opens.
Use the Custom Reports when the fixed reports don't fit
Vote Custom Report and Jira Custom Report exist precisely because the other 7 have a fixed shape. If a stakeholder wants "story points by sprint by issue type, but only for Bugs," that's a Custom Report question, not a request to wait for a new fixed report to be built.
Trust the Magic Wand explanation over guessing
Every chart and table has its own deterministic explainer — click it before assuming what a number means, especially on Executive Summary where 10 different data sources are combined onto one page.
Re-run before presenting
Every report shows a real "Data as of" / "Last updated" timestamp and a Refresh button — reports aren't cached snapshots that go stale the moment the underlying sprint changes.
Who benefits, and how
Rating this page
Anyone reading this documentation can mark whether it answered their question — no permission required. It only helps the SprintUnity team see which pages need more detail.