Sprint Intelligence & Health
See the real health of your sprint — Scope, Schedule, Capacity, Quality and Risk, in one view. "Sprint Intelligence" isn't a single screen: it's a family of five related pages, each answering a different question with the same underlying data.
The 5 screens, in depth
1. Sprint Intelligence — the Health Score home
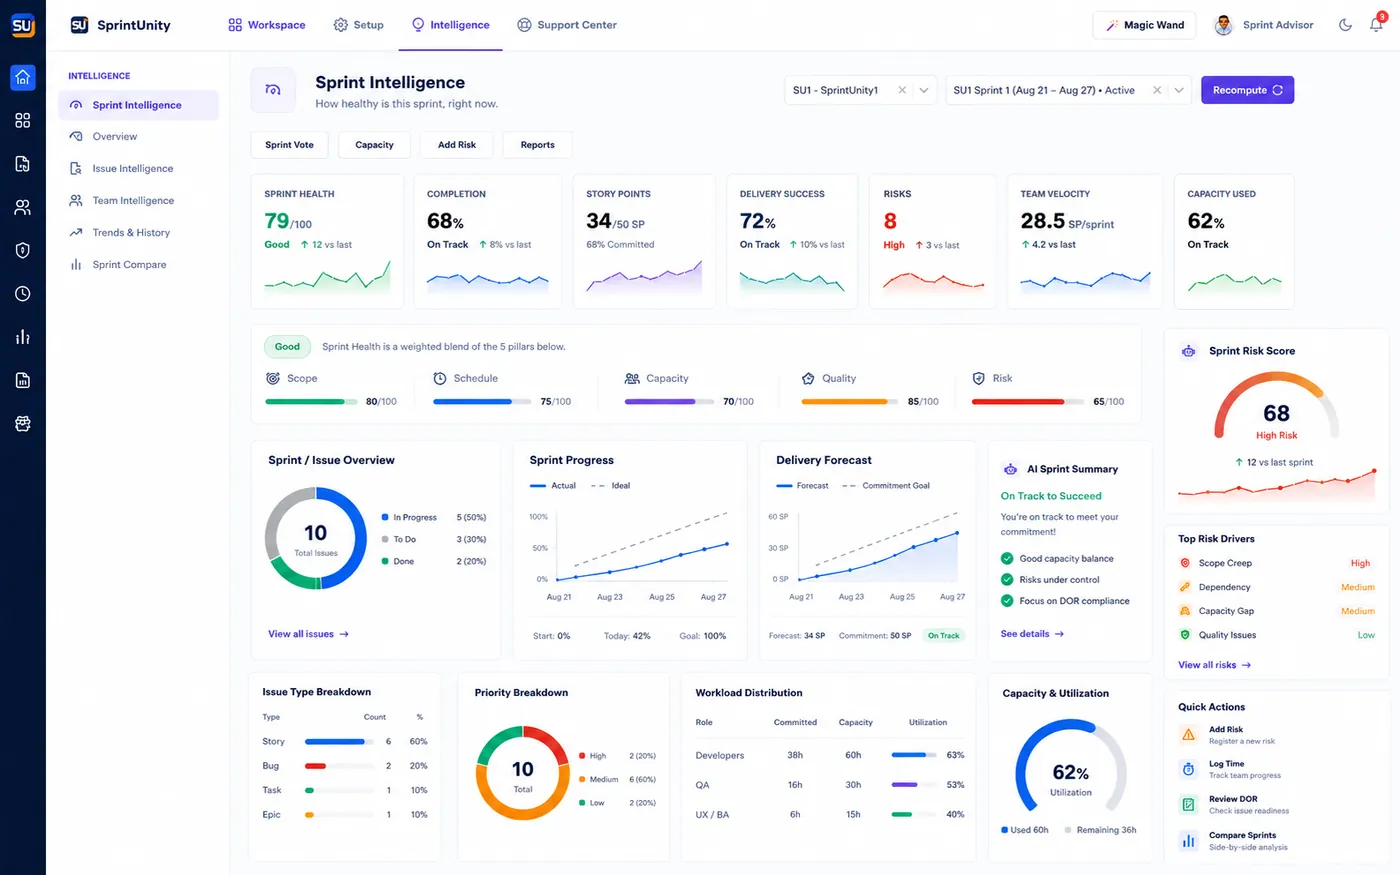
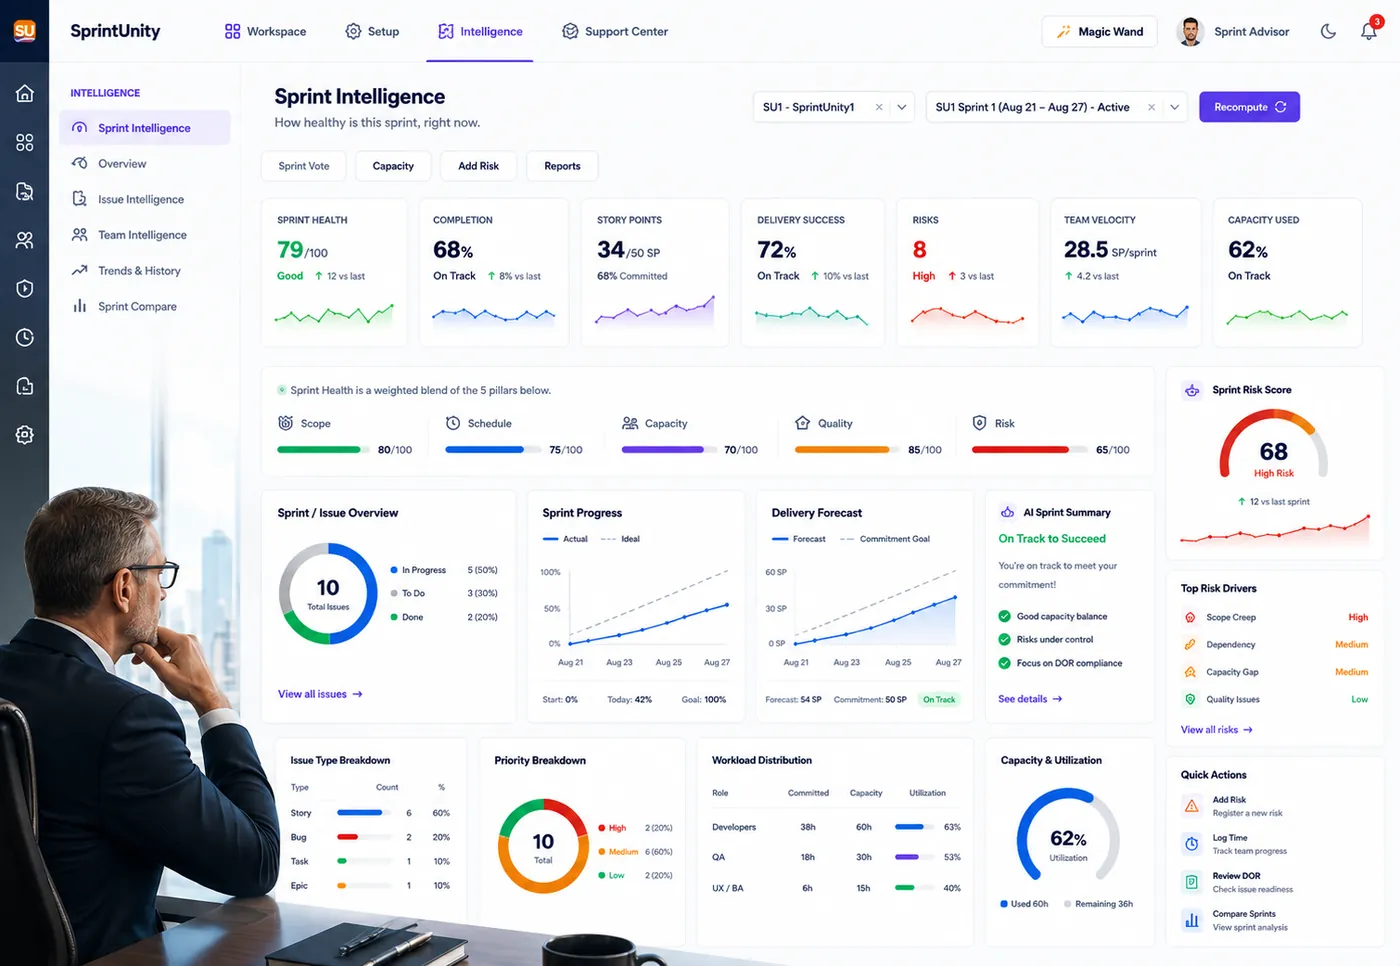
This is where the Sprint Health Score itself lives. Top to bottom: a KPI row (Sprint Health, Completion %, Story Points, Delivery Success %, open Risks, Team Velocity, Capacity Used), a strip showing all 5 pillar bars side by side, then three rows of panels — Sprint/Issue Overview, Sprint Progress, Delivery Forecast, and an AI Sprint Summary; Issue Type Breakdown, Priority Breakdown, Workload Distribution, Capacity & Utilization; and Issue Readiness, Quality & Readiness, Top Risks, and a Key Metrics Summary with sparklines. Quick Actions jump straight to Sprint Vote, Capacity, Add Risk, or Reports.
2. Team Intelligence — Team Health & Quality
A separate page, own "Analyze Team Performance" action. Shows Team KPIs (Velocity, Completed Work, Avg Cycle Time/Flow Efficiency, Capacity Utilization, Quality Score), a 5-sprint Velocity Trend, a Work Distribution donut, a per-member Team Performance table, Logged Hours by Member, and a Team Health panel. This is the real home of Team Health Score and Quality Score — see the formulas below.
Clarification: the per-member table shows each person's share of the team's completed story points — explicitly documented as not a ranking or performance score.
3. Issue Intelligence — flow & delivery metrics
A separate page focused on flow, not health pillars. Issue KPIs (Total/Completed/In Progress/Blocked/Avg Cycle Time/Reopened, each with a vs-last-sprint delta), Issues by Status and Issue Type donuts, Priority Distribution, Cycle Time and Lead Time analysis (average/median/p90/min/max with trend), an Estimation Accuracy donut (under / accurate within ±20% / over, with variance vs. logged time), and a Top Issues table sorted by longest cycle time.
4. Issue Maturity — the readiness rules (admin)
Not a metrics dashboard — this is where an admin configures the rules that produce the "Issue Readiness" score shown elsewhere. Admins define per-issue-type Assessment Profiles: weighted rules (required field, text length, option selected, number, date, attachment count, issue link, JQL expression, regex) whose weights must sum to 100%, plus a "Ready" threshold percentage.
5. Trends & History — snapshot and long-term view
Two independent sections. Sprint Snapshot (scoped to the current project/sprint): four KPI cards — Completed SP, Logged Time, Open Risks, and average Sprint Risk Score — each with a sparkline and a vs-previous-sprint comparison, plus a Capacity Summary and Work Hours Overview (expected vs. actual). Historical Performance (tenant-wide, date-range scoped): a Sprint Risk Score distribution donut (Critical/High/Medium/Low) and a paginated, exportable table across every sprint — Sprint, Project, Completed SP, Logged Time, Sprint Risk Score, Open Risks, Delivery Gap %, and DOR Compliance %.
Sprint Health Score — the exact calculation
One 0–100 number, blended from five independently-scored pillars:
Schedule and Risk together are 45% of the score — check those two first when Health drops. The Risk pillar is literally 100 − Sprint Risk Score (below), so a bad Risk Score always pulls Health down proportionally, never silently.
Sprint Risk Score — the exact calculation
Documented explicitly as an indicative management score, not a probability of sprint failure.
Every open or monitoring risk gets severity points
Manual risks: probability (1–5) × impact (1–5) = a 1–25 raw score, classified as critical (≥16), high (≥10), medium (≥5), or low. Automated risks get a flat point value directly. Severity points: low = 3, medium = 9, high = 15, critical = 20.
Points are summed, resolved risks excluded
Only currently open or monitoring risks count toward the sprint's raw score.
Normalized against a fixed ceiling
The ceiling is 75 points — deliberately chosen as "5 concurrent High risks." Sprint Risk Score = min(100, round(rawScore ÷ 75 × 100)).
| Score | Level |
|---|---|
| 76 – 100 | Critical |
| 51 – 75 | High |
| 26 – 50 | Medium |
| 0 – 25 | Low |
This same score and the same band function power three places at once: the Risk pillar on Sprint Health, the Quality Score on Team Intelligence, and the rollup on Home — so they can never quietly disagree with each other.
Team Health Score & Quality Score — the exact calculation
Team Health uses the identical 0–100 scale and band labels as Sprint Health:
| Score | Team Health level | Quality Score level |
|---|---|---|
| 90 – 100 | Excellent | Excellent |
| 80 – 89 | Healthy | Good (75+) |
| 70 – 79 | Watch | Fair (50+) |
| 60 – 69 | At Risk | Needs Attention (<50) |
| Below 60 | Critical | — |
Quality Score calculation: 100 − (openRiskPoints ÷ 75 × 100), capped 0–100 — it deliberately reuses the exact same inputs as Sprint Risk Score, so Team Intelligence's Quality Score and a sprint's Risk Score never tell two different stories about the same open risks.
Why "Recompute" sometimes takes a moment
Sprint Intelligence, Team Intelligence, and Risk Management analysis can take longer than Jira's Forge platform allows a single request to run (25 seconds). So clicking Recompute or Analyze doesn't calculate inline — it queues a background job (up to 15 minutes) while the page quietly polls for a fresh result every 4 seconds, for up to about 3 minutes. Benefit to you: the app never times out or shows an error for a large tenant — it just takes a few extra seconds, with a visible spinner the whole time.
Ask Sprint Advisor about this
Sprint Advisor's "sprint intelligence" skill category answers questions about the Health Score, its pillars, and what's driving them right now, directly from this same data — never a recalculated or separate estimate. See AI Sprint Assistant for how it works.
Rating this page
Anyone reading this documentation can mark whether it answered their question — no permission required. It only helps the SprintUnity team see which pages need more detail.